Saturday, December 20, 2014

Black voters - especially conservatives - assume Black candidates share their political ideology

Voting is a notoriously fickle activity. And why wouldn't it be? Each voter gets only a tiny fraction of a percentage of a say in who their electoral representative will be and so it is unsurprising many voters will make a more automatic, intuitive judgment on their vote rather than through careful and time-consuming consideration of the costs and benefits to them or to the people at large.

Often we vote for people we think look like ourselves or seem like ourselves. When Mitt Romney, a Mormon, ran for president, evangelicals and atheists worried about whether he'd be suitable, while George Bush, an evangelical, drew his support from the evangelical community. Voters prefer an 'everyman' candidate who they can relate to – imagine having a beer with – to a candidate they might concede as more intelligent, but could seem out of touch. All of this might be completely rational – who better to represent your voice than a representative who thinks like you? Black Americans flocked to support President Barack Obama over his opponents – their support was essential, in fact, to getting him and keeping him in the White House. Only 39% of White Americans voted for Obama in 2012, compared to 93% of African Americans.

Berkeley researchers Amy Lerman and Meredith Sadin set out to understand why African Americans in particular have such a strong preference for African American candidates. It has been argued that Black voters prefer to give up being represented by someone who thinks like them in order to get a representative who looks like them. Lerman & Sadin wondered if that was accurate. Black voters considering a Black candidate see an in-group member; White voters, at least racially, see an out-group member. Group identities are important for everyone, and everyone sometimes uses stereotypes to judge others by group membership, in-group or not. This is especially true if we're making an automatic, intuitive decision as in the way many of us make up our minds about voting.

The researchers predicted several findings related to stereotyping Black candidates:
  1. White voters will stereotype a Black candidate as being more liberal than an identical White candidate, because of racist stereotypes about Black people or simply because they use a statistical probability heuristic.
  2. Black voters have a stronger racial identity than White voters, both because they are a numerical minority and because they're a particularly oppressed minority – more so than other racial minorities in America. Because of this, they'll project their own beliefs onto candidates more than both Whites and other racial minorities.
  3. Because statistically, Black candidates tend to be more liberal, Black conservatives will experience greater cognitive dissonance between wanting a candidate who represents their views, and one who looks like them. To cope with that, Black conservatives will use projection more than Black liberals.
  4. The degree to which a voter projects their views on a candidate predicts their likelihood of voting for that candidate.
The authors described a hypothetical candidate to over 3000 people. The description included a picture of the candidate, either as a Black or a White person. There were Black and White people who judged the candidates based on their race, but they tended to make those judgments in different ways.

In the sample of 3000 people with hypothetical candidates, Black people tended to judge the Black candidate as 'like them' ideologically. Black conservatives thought the Black candidate was more conservative then the White candidate, while Black liberal didn't significantly draw strong conclusions about the candidate from the candidate's race. In a subsequent analysis of the American National Election Survey, White Americans tended to stereotype their Black representatives as much more liberal than White representatives. Black Americans showed similar patterns to the sample of Black participants in the study sample. Going back to the question of what Black voters do when choosing between voting for a candidate who looks like them or a candidate with their political ideology, it seems like Black voters have their cake and eat it too: they tend to assume the candidate who looks like them has their ideology.

White conservatives judged White representatives as more conservative than they judged Black representatives.
White liberals stereotyped White candidates as more conservative than Black candidates.
Black conservatives thought Black candidates were more conservative, preferred them, and were more likely to vote for them.
Evidence unclear, but Black liberals perhaps more likely to vote for a Black candidate

While Black voters might not prefer a Black candidate simply because they share skin color, they do perceive Black candidates as more ideologically similar to them and are more likely to vote for the Black candidate compared to a White candidate. This was most true for Black conservatives. If this holds out in the future and in the population at large, it might imply that Black candidates, particularly liberal Black candidates, can take advantage of support from Black voters regardless of whether their ideology matches up with the people they represent.

In follow-up studies, the authors applied their analysis to Latinos – but for whatever reason, the effects they saw in the Black population didn't transfer to the Latino grouping. A lot of Latinos self-identify as White and the grouping may be less cohesive than the Black racial grouping. So whether the results apply to minorities in New Zealand like Maori, Pacific or Asian ethnic groups could be the subject of future research.

Sunday, September 28, 2014

Low voter turnout, a landslide for National, and a lack of good alternatives are probably all linked

77% of New Zealanders turned out for our recent election. In many countries, 77% would be an awesome turnout; in NZ, it's one of our worst results in 100 years (only 2011 and 2002 were worse).

So, why didn't New Zealanders vote?

Demographics be the first answer to try. Which group of New Zealanders didn't vote? Of course non-voters might have different hypothetical preferences to people who fit in similar demographic boxes, but who are voters. But it might give us some idea. Statistics NZ is likely to be collecting that kind of data. In the past, it's been less-educated, younger, and non-white ethnic groups that have less of a say.

Alternatively, we could ask people why they didn't vote. Statistics NZ did that last time around, and this is what they found:
  • 64% of non-voters had considered voting in this Election.
  • 43% of non-voters decided on Election Day that they would not vote.
  • 41% of non-voters put just a little thought into whether or not to vote, and 29% didn’t think about it at all.
  • The main overall reasons for not voting were that they had other commitments (14%) or work commitments (9%), could not be bothered voting (14%), couldn’t work out who to vote for (11%) and that their vote would not make a difference (8%).  
  • 33% of all non-voters agreed ‘I don’t trust politicians’ was an important factor (4 or 5 out of 5) on their not voting.  Other important factors were ‘it was obvious who would win so why bother’ (31%), and I’m just not interested in politics (29%).  Since 2008 there has been an increase in the proportion of non-voters saying ‘it was obvious who would win so why bother’ (from 19% to 31%).
A number of these reasons seem to relate to whether it's perceived there's a real choice voters can make. If:
  • the result seems predetermined
  • one side seems particularly appealing
  • the other side seems particularly unappealing
  • there doesn't seem to be much real difference between the candidates/parties
we might expect turnout to be lower.

Does this bear out across previous elections in New Zealand?

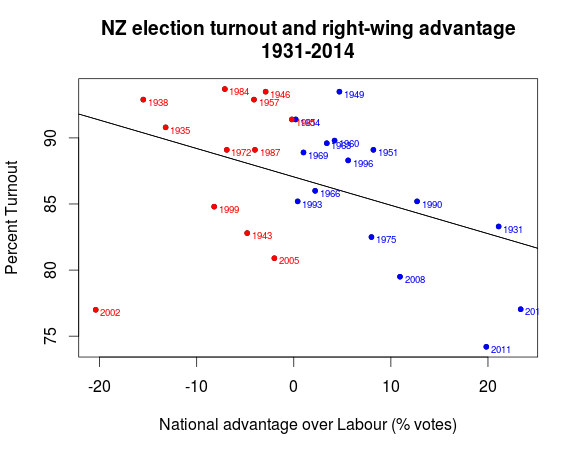
We can look at the margin between the two sides to see whether more people turn out to vote when there's a very close election, compared to when there's not much of a real choice.

The graph above shows the percentage turnout for each election between 1931 and 2014, excluding 1978 when data was not available. Elections with a National advantage are shown as a blue dot; elections with a Labour advantage are shown as a red dot. There does seem to be a significant trend apparent: the greater the margin between political parties, the lower the turnout (ρ[43]=-.41, p=0.033). So it seems like turnout has something to do with whether voters thought there was a genuine contest.

Does this effect seem to work on Labour supporters more than National supporters? Maybe National voters are habitual voters who reliably turn out every election, while left-wing voters only really come out if they can see a party worth supporting, a genuine choice, and a genuine chance of winning. We can take a look at the data above from a different angle:


The graph shows elections between 1931 and 2014, excluding 1978 where data wasn't available. National wins (those with “advantage” greater than 0, on the right side) are shown with a blue dot. Labour wins (those with “advantage” less than 0, on the left side) are shown with a red dot. It looks as if when turnout gets worse, National does significantly better in elections (r[43]=-.41, p=0.035).

So what does it mean? It seems like as the gap between the percentage of votes for each of the major parties increases, turnout gets lower. It's hard to say which direction the effect is in, but it does seem like voters for the losing side just doesn't turn out. Also, that effect might apply more when Labour's losing, because in general, National does better when turnout is low, while Labour does better when turnout is high.

If this pattern applied for the last election, where turnout was among the lowest ever, then the low turnout, and National's MMP 'landslide', is at least in part due to the lack of choice voters felt. Maybe it seemed like the outcome was inevitable. Or, voters didn't think Labour represented a real alternative – either because they weren't much different from National, or they didn't seem to be a better government than National, due to policy or leadership or some other reason.

If this election was generally like past elections, then low voter turnout, a landslide for National, and the lack of good alternatives are probably all linked.


Sources
http://www.elections.org.nz/events/past-events/general-elections-1853-2011-dates-and-turnout
http://www.elections.org.nz/news-media/preliminary-results-2014-general-election
Raw data and statistical analysis code is available on request.

Thursday, July 24, 2014

Voter turnout

Psychologists and political scientists have studied voter turnout and identified social pressure and identity as some of the strongest factors which can be changed to influence people to vote. In New Zealand, voter turnout in 2011 since before voting was extended to women in 1893!

Voter turnout varies a lot from one election to the next and can be quite important in determining election outcomes. Changes in voter turnout can be much larger than the margin by which a new government wins office. For instance, in the New Zealand general election in 2011, the governing and supporting parties (National, Maori, ACT, and UF) won 93,939 more votes than the opposition parties (Labour, Greens, NZ First, and Mana) in Parliament [1]. Turnout had dropped from 79% in 2008 [2] to only 74% in 2011, which was an absolute difference of 177579 extra voters who were eligible to vote and didn't – in other words, if just the voters who had voted in 2008 election had all voted in 2011 (not including the 20% of eligible voters who didn't vote in either election), they could have changed the election outcome!


Party group Votes
Government (National, etc) 1127950
Opposition (Labour, etc) 1034021
Difference 93929


Year % Turnout Non-voters
2008 79% 614279
2011 74% 791858

-5% -177579


This makes turnout potentially an important decider in elections. Historically, political campaigners know this and have spent a lot of energy either trying to convince people to vote in Get out the Vote campaigns, or - arguably - trying to discourage people from voting with poll taxes, voter ID laws, etc.

Behavioral researchers have examined the design of elections and how the design of an election could encourage or discourage people to vote, and also tactics which political campaigners might be able to use to encourage people to vote.

Exploring social influence: Bischoff & Egbert [3] wrote about how people choose a candidate, not about turnout in general, but the principles could apply to deciding whether to vote at all, as well as deciding to vote for a particular candidate. People might look to others in their social group or other people like them as a guide for picking the best candidate, particularly if they're not confident of being good judges at that. People could also follow their peers not because they necessarily thought their peers were good at picking good candidates but simply to fit in with their peers. People might also want to vote for the candidate they thought would win, regardless of whether they really preferred the candidate because either they just want to reduce uncertainty or to reduce future anxiety from seeing their candidate lose and having to confront the idea the “worse” candidate won.

Identity as a voter: Christopher Bryan and colleagues [4] at UC-Irvine found they could influence voting by surveying voters about “being a voter” or simply about “voting”. They thought that a person's identity is important to them, that in general, people believe voting is a positive thing or a moral good or at least a civic duty, and so that if they prompted people to think about voting as an identity “being a voter”, people would prefer to claim that identity for themselves in order to improve their image or their identity. Conversely, if people were asked about voting, they'd be less likely to think of being a voter as an identity and so being motivated to improve their image and identity wouldn't lead them to vote. People actively manage their self-concepts and try to improve it by doing things which improves their self-concept – if surveyors suggest that “being a voter” is relevant to an identity, it becomes more relevant to participants' self-concept.

Social pressure also seemed to help – a little bit. In elections in New Jersey (2005) and California (2006) [5], people were given information over the phone either that voter turnout was low and declining, or that it was the highest it has ever been. They were later given a survey asking them about their likelihood of voting. Across the two experiments, prospective voters were on average about 4% more likely to say they would definitely vote when they were told voter turnout was at record highs than when they were told it was declining.

Another study [6] didn’t find that telling people about turnout in their own community influenced turnout, but reminding people that their vote was a matter of public record – displaying whether they voted previously – did significantly improve turnout. Even thanking voters [7] for voting via a mailout produced a significantly higher turnout in the next election, compared to voters who got a generic reminder mailout which didn’t thank voters for voting previously.

Self efficacy and socioeconomic status: One unexpected finding came from a study [8] comparing 18 and 19 year old first-time voters, split into two groups depending on whether the voter had a mother who graduated from high school. It seems like a strange thing to look at, but researchers used mother’s education as a general, rough measure of someone’s socioeconomic status. It turned out that 43% of young people with a high school graduate mom turned out to vote while only 29% of young people whose mom didn't graduate came to vote on the day. The same study found 'general self efficacy' predicted how likely young people were to vote, especially when they came from those disadvantaged backgrounds. 'General self efficacy' is a measurement of how much people agree with general statements like:

I can do just about anything I really set my mind to.”

I can solve the problems I have.”

Only about 2 of every 10 young people from those disadvantaged backgrounds voted if they were in the lowest 25% on the self efficacy scale, but that proportion rose to 3 or 4 in 10 for the highest 25% on the self-efficacy scale. From 2 to 3 or 4 out of 10 might sound like a fairly small increase but it represents an increase in turnout by an extra half or even doubling of the low-efficacy group.

This leads to an open question – is efficacy something we can induce in prospective voters in this case? Not only does it increase turnout, but stronger efficacy in general seems to be particularly helpful for young people from disadvantaged backgrounds. So finding ways to increase efficacy – even if it is domain-specific to voting – could be particularly effective in addressing social disparities in voter turnout.

It's really striking how much intergenerational influence could potentially affect an entire generation’s ability to have their civic voice heard in elections.

Voter turnout is a problem of motivation and a desire to change an election outcome, in itself, might not be the most powerful motivator to vote for an individual. Many voters probably understand that individually, their vote is highly unlikely to change the outcome of an election, yet because of social norms about voter civic duty, social pressure, peer influence, and gratitude and other psychological factors which can be influenced by even by a voter’s mother’s education, can play a part in getting voters out to vote. Getting voters to vote as a way to make a statement or feel good about participating in a civic duty may be a much more effective way of motivating voters than simply informing them of the issues at stake.

References

[1] http://www.electionresults.govt.nz/electionresults_2011/e9/html/e9_part9_1.html
[2] http://www.electionresults.govt.nz/electionresults_2008/e9/html/e9_part9_1.html
[3] Bischoff, I. & Egbert, H. (2013). Social information and bandwagon behavior in voting: an economic experiment. Journal of Economic Psychology, 34:270-284.

[4] Bryan, C. J., Walton, G. M., Rogers, T., & Dweck, C. S. (2011) Motivating voter turnout by invoking the self. Proceedings of the National Academy of Sciences of the United States of America. doi:10.1073/pnas.1103343108.

[5] Gerber, A. S., & Rogers, T. (2009). Descriptive social norms and motivation to vote: Everybody’s voting and so should you. The Journal of Politics, 71(1), 178–191.

[6] Panagopoulos, C., Larimer, C. W., & Condon, M. (2013). Social pressure, descriptive norms, and voter mobilization. Political Behavior: doi:10.1007/S11109-013-9234-4.


[7] Panagopoulos, C. (2011) Thank you for voting: gratitude expression and voter mobilization. The Journal of Politics, 73(3):707-717.

[8] Condon, M. & Holleque, M. (2013) Entering politics: general self-efficacy and voting behavior among young people. Political Psychology, 34(2): ddoi: 10.1111/pop.12019.


Thursday, September 12, 2013

Would our world be more peaceful if women were on top?


Would our world be more peaceful if women were on top? That’s a question a number of people have asked in recent times. Given the New Zealand Labour Party's recent controversy on equalising the representation of women within their party, the question seems like it might be particularly topical in New Zealand right now. Men are aggressive, impulsive, and love a good fistfight, while women are caring nurturers who value relationship...or so the stereotypes tell us. Stephen Pinker in his book The Better Angels of Our Nature notes that more violent areas of the world happen to be those which lag behind others in the empowerment of women. Micah Zenko at foreignpolicy.com thinks women are less inclined to start wars, but Rosa Brooks at the same site thinks women can get tough and aggressive just like men can. In this post I outline some of the more general knowledge gathered about what ordinary women and men think about war, and then make a little preliminary analysis on what men and women in power think about war – which might be the real determining factor here.

This Pew Research study got people talking about the issue recently. Pew Research asked men and women all around the world whether or not they approved of Obama’s drone strike program. There was a large difference between countries. 61% of Americans approved of the program, but only 43% of Ugandans and 21% of Spaniards. But there was also a large and consistent gender gap. Of the countries listed in Pew’s report, the discrepancy was largest in Japan, where 41% of men but only 10% of women approved of drone attacks. But the gap was everywhere – in Australia, almost twice as many men (58%) as women (30%) approved of drone strikes, and in the US, where approval was the highest, a staggering 70% of men approved of the strikes, though only just over half (53%) of women did.

Looking at that gender difference on military force more generally, Micah Zenko’s article enumerated an impressive list of how often men in the USA as well as around the world seemed to be particularly fond of use of force in pretty much all the major wars the US has fought over the last 20 years. Eichenberg [1] published a comprehensive study looking at gender differences in use of force in 486 different survey questions in the US from 1990 to 2003. He found that American men are more likely to support military force for any purpose more than American women are. Looking at the justifications that were given for each military intervention in question and the kind of military force, men didn’t seem to be so concerned about humanitarian issues and loss of life.

Despite all this research into what ordinary men and women think, gender differences in the ordinary population mightn’t tell us anything about what women and men in power do with their power. Just as the surveys found that the gender gap between men and women wasn’t the same right across the world – it seems to be stronger in some countries than others – groups of women and men within a country might differ. The kind of people who get selected to be politicians might be the more aggressive, bellicose types we associate with masculinity rather than feminity. Maybe that kind of aggressive, bold personality is just the type needed to succeed in politics and gain positions of power. If women eventually get to make up 50% of the US Congress, of Parliaments around the world, it might be because women manage to catch up and become just as aggressive as men already are. If that’s the case, then more women in power through more aggressiveness isn’t going to make the world any more peaceful. Maybe there’s a simple psychological trait called something like ‘aggression’, which men have more of, which makes men more likely to support war and more likely to get political power than women. In that case, we could expect the few women who make it into politics are the kind of women who have more aggressive, masculine attitudes and consequently, women in power already are no more aggressive than men in power.

Men and women in power

To test this, I took a look voting records of men and women in the US Congress and how they voted on authorization for the US war in Iraq in 2002, and for supporting the use of force in Libya in 2011. When I looked at Iraq, the difference seemed to be clear. There were only 12 out of 100 senators who were woman at the time, so it’s not even worth looking at data in the Senate. But in the house, the data were interesting and seemingly clear:

Men vs. women in Congress voting for military action against Iraq in 2002

Percentage of men and women in the House of Representatives who voted to pass the Bill To Authorize the Use of United States Armed Forces Against Iraq. Voting records: Clerk of the House of Representatives.

But the first thing to remember is that US Democrats tended to oppose the war, not only on ideological reasons but also because it was the opposing Republican President, George W. Bush, who was advocating for war. That could skew the results, because while just 20% of congressional representatives in the Democratic Party were women, just a tiny 7% of Republican representatives were women. So it’s worth looking at those differences for each party:

Men vs. women in Congress voting for military action in Iraq in 2002, by party
Percentage of men and women Democrats and Republicans in the House of Representatives who voted to pass the Bill To Authorize the Use of United States Armed Forces Against Iraq. Voting records: Clerk of the House of Representatives.

Although there were large differences between each party, certainly a larger proportion of male Democrats (44%) than female Democrats (20%) voted to authorize force. The sample of female Republicans – just 15 – is really too small to make any statement. Thinking back to our original question – what if women were in charge? – it might be interesting to see what would have happened if all men voted along the same proportions that women did:
Military action
No military action
169
260

 In this comparison, “No military action” wins, 260 votes to 169. If, in 2002, men in congress had voted the way women in congress did, the Iraq war would never have happened! But we need to remember the difference between the parties reflects how the wider population choose their leaders. Presumably the vote that determined who got into Congress also chose Republicans for their policies, and Democrats for theirs. So we could look at how the vote would have been if men overall had voted the same way women in their own party did:

Military action
No military action
Republicans
204
15
Democrats
41
167
Total
245
182

In that case, military action would still have won out, 245 votes to 182, though the margin would be slimmer (57% to 43%) than it actually was in history (73% to 39%). When we consider the way that people voted for political parties, and that party membership probably tells us as much or more about the way a congressperson votes than their gender, it looks like that there’d still be enough bellicose women around to join with the men in taking the US to war.

Results were even more mixed when the US Congress came to vote on supporting Obama in an air strike on Libya:
Men vs. women in Congress voting for military action in Libya in 2011
 Percentage of men and women in the House of Representatives who voted for the Bill Authorizing the limited use of the United States Armed Forces in support of the NATO mission in Libya. Voting records: Clerk of the House of Representatives.

This time, it appears superficially that women (42%) actually appeared to be more likely than men (27%) to support military action. But as before, the more meaningful figures seem to be tied up with party membership:
Men vs. women in Congress voting for military action in Libya in 2011, by party

Percentage of men and women Democrats and Republicans in the House of Representatives who voted for the Bill Authorizing the limited use of the United States Armed Forces in support of the NATO mission in Libya. Voting records: Clerk of the House of Representatives.

It seems like the reversal had a lot to do with party membership. When a Republican President wanted to go to war in 2002, the Republican party were more likely to endorse the war. Similarly, when a Democratic President wanted to go to war in 2011, the Democrats were more likely to support him. The majority of Congresswomen are Democrats, so that made women appear to be more supportive of war. Looking at the difference between men and women Democrats (again, there are too few Congressional Republican women to really make a judgment), there was very little difference between male and female.

So would the world be more peaceful if women were on top?

Women tended to more strongly oppose the War on Iraq in 2002 than men did. But there could be a number of explanations for that. Maybe more liberal congressional districts were more likely to elect female Congressional representatives, and also – independently - more likely to elect doveish representatives. To test this, we’d need to somehow measure how liberal each district is. Dividing Congress into Democrats and Republicans is a good start, but since there’s a lot of variation in each party, we should look more carefully at the attitudes toward war that Congressional Districts who elect Congressmen and Congresswomen have.
Women were also at least as likely to support the use of military force to support the NATO mission in Libya in 2011.  That might hint at the difference Eichenberg found in women’s support for causes justified on more humanitarian grounds.

This seems like a good start. Of course there were a whole lot of wars fought over the last 20 years, and not only the US Congress but legislative bodies around the world voted on them. If we take a larger look at those voting records, we might see a pattern emerge, where at least for a certain kind of war, women tend to be a lot more peaceful than men.

One of the main objections to the argument that more women in power would make the world more peaceful is that, if more women were voted in, it would be because women somehow became more like men, in becoming more aggressive or masculine or taking on other traits that make them more likely to survive in politics and more likely to support war. But when we consider a quota system like the New Zealand Labour Party has sought to introduce, the effect might be quite different. Under a quota system in present-day society, even though women would make up 50% of representation, we still live in a society where the data seem to suggest women in general show greater concern for loss of human life and humanitarian concerns [1]. Although a quota system has been derisively labelled as a 'man-ban' by critics and the media, it might actually - in some limited ways - produce a better outcome than if women representatives changed so that electorates voted in 50% of them even without a quota.


[1] Eichenberg, R. C. (2003). Gender differences in Public Attitudes toward the Use of Force by the United States, 1990-2003. International Security 28(1): 110-141.

Tuesday, September 3, 2013

Poverty even makes it tough to think properly

In public political debate there are those who want to blame the poor for their own poverty, perhaps characterizing them as lazy or lacking some other kind of character trait a person needs to earn money. Recently, celebrity cook Jamie Oliver generated controversy with a comment beginning with a disclaimer which tends to set off the alarm bells, “I’m not judgmental, but…” (uh-oh)
"I'm not judgmental, but I've spent a lot of time in poor communities, and I find it quite hard to talk about modern-day poverty. You might remember that scene in [a previous series] Ministry of Food, with the mum and the kid eating chips and cheese out of Styrofoam containers, and behind them is a massive fucking TV. It just didn't weigh up."The fascinating thing for me is that seven times out of 10, the poorest families in this country choose the most expensive way to hydrate and feed their families. The ready meals, the convenience foods." [1]

An article published in Science last week [2] described an experiment where people were asked to do a simple ‘which-shape-fits-in-the-blank’ task similar to some questions which might appear in IQ tests. They gave some good evidence that simply being poorer, having financial issues on the mind, can make it more difficult to perform on their test. It’s a nice demonstration that actually fits with the popular idea that in some way, poverty is a result of poor people’s behavior, while underscoring that a person’s behavior is affected by circumstance and being financially secure can make it easier to act smarter. Conversely, being financially vulnerable makes good decision-making harder and could potentially trap people into a cycle of poverty for which you can hardly blame them. The effect of financial vulnerability could be pretty strong; the experimenters compared the effects they found with other studies and suggested that “evoking financial concerns has a cognitive impact comparable with losing a full night of sleep”.

In an experiment with richer and poorer Americans, the experimenters asked each person a financial question first to get them thinking about money, which was “Your car is having some trouble and requires $1500 to be fixed. You can pay in full, take a loan, or take a chance and forego the service at the moment. How would you go about making this decision?” As a control, they repeated the same experiment but used $150 as the amount instead of $1500.  The experimenters say they expected that when the financial question involved $1500, the problem would be difficult for poorer participants but not for richer ones, although they expected no difference for the smaller amount (150). That’s exactly what they found – poorer people performed significantly (p<0.001) worse in the ‘fill-the-blank’ task than richer people did. They repeated the experiment without the financial question, to make sure people weren’t getting stressed out by larger numbers. Illustrating how bad performance in intellectual challenges might trap people into further poverty, the experimenters repeated the experiment, with similar results, where people were paid $0.25 per question they got right. The poorer people on average walked away from the experiment with 18% less than the richer people did, so in some way, even the experiment itself functioned to perpetuate and magnify the gap between rich and poor.

The experimenters wanted to make sure that the gap in between the rich and poor they saw didn’t just hold for the moment right after people face a tough financial decision. To do that they found that sugar cane farmers from Tamil Nadu in India struggled significantly more (p<0.001) with the ‘fill-the-blank’ tasks before harvest than after harvest, when they got paid and had fewer financial difficulties. The effect held no matter what time of year harvest occurred. Experimenters even collected heart rate and blood pressure as a way of measuring stress, and they found that even taking those factors into account, farmers still struggled more with the task before harvest. That showed that the effect they saw wasn’t fully caused by stress, at least as far as stress measured by heart rate and blood pressure is concerned. Though stress could have been a factor, the researchers thought that because an effect remained regardless of stress, the mere background cognitive demand on the farmers during hard financial times caused them to perform more poorly.


Is this even a new thing?

This study does a good job demonstrating a link between financial circumstances and cognitive ability. But it is far from the first to examine the nasty way poverty works as a catch-22 to trap people and stop them from getting ahead in the way we’d like to think people can in an egalitarian or meritocratic society. Childhood poverty seems to predict the size of people’s working memory, and mainly through chronic stress, i.e., child poverty is related to chronic stress and that chronic stress caused most of the relationship between poverty and a poor working memory as an adult [3]. IQ is even correlated worldwide with national GDPs, and when GDP rises, so do IQs, suggesting that access to money and resources helps determine IQ, not (or not only) the other way around [4].

So…?

Based on what they found, the study authors suggested that government work and income programs need to avoid adding stress and complexity to application processes for receiving income support or assistance in finding work. If beneficiaries are to be helped back into work, too much cognitive load spent thinking and worrying just about access to benefits might hinder their ability to find work. Government austerity measures which introduce new hoops beneficiaries must jump through to access government support might be intended to reduce the amount of money the government spends on income support. In the long run, the cognitive load effect observed in the study could work against such austerity measures, working to increase the amount of time it takes for people to find work and hence be dependent on government support.
More broadly, the new Science study shows that, where people in poverty are struggling to get ahead, poverty itself can prevent them from leaving poverty behind, through a harmful, though temporary, effect on intelligence. Thus, not only is it futile to blame this detrimental effect on someone’s cognitive ability on them, since it is outside of their control, the poverty effect could be relieved if only a person had relief from poverty and excessive financial concerns. Such a fact has substantial implications if we want to make our society any kind of egalitarian or meritocratic one in which the skills of every individual are fully realized for society as a whole.


[1] Deans, J. Jamie Oliver bemoans chips, cheese and giant TVs of modern-day poverty. The Guardian, 26 August 2012. Retrieved from  http://www.theguardian.com/lifeandstyle/2013/aug/27/jamie-oliver-chips-cheese-modern-day-poverty on 31 August 2013.

[2] Mani, A., Mullainathan, S., Shafir, E., & Zhao, J. (2013) Poverty Impedes Cognitive Function. Science 30 August 2013: 976-980. Retrieved from http://www.sciencemag.org/content/341/6149/976.on  on 31 August 2013.

[3] Evans, G. W. (2009) Childhood poverty, chronic stress, and adult working memory. Proceedings of the National Academy of Sciences of the United States of America 106(16):6545-6549. Retrieved from http://www.pnas.org/content/106/16/6545.long on 31 August 2013.

[4] Roiviainen, E. (2012) Economic, educational, and IQ gains in eastern Germany 1990-2006. Intelligence 40(6): 571-575. Retrieved from http://www.sciencedirect.com/science/article/pii/S0160289612000864 on 31 August 2013.

Tuesday, August 27, 2013

Nudging kiwisaver

New Zealand’s kiwisaver scheme has proven to be a political success. Created in 2007 in response to an impending slump the number of people in work relative to people in retirement, funds have grown by leaps and bounds. The plan has now become a politically and fiscally indispensable part of New Zealand’s future collective retirement savings. As of March 2013, membership had reached 2 million, or just under half of New Zealand’s total population of 4.4 million [1]. Since 2008, members have saved over $14 billion, or 40% of the $35 billion in New Zealand super funds [2].
There’s a number of changes one could make to kiwisaver to make it a better fit for the way people relate to their money and retirement savings in practice. Much of basic economics assumes people are ‘homo economicus’, an entirely rational human capable of perfect market action, but knowledge about human psychology – our biases, systematic mistakes, and evolutionary ‘flaws’ -  can help us design a savings system better suited for homo sapiens. There are a number of features in kiwisaver that approach an intuitive, homo sapiens model, but several improvements could be made. First, there may be more cost-effective ways to incentivise people to join the plan - and commit an adequate level of savings to it - than putting $1000 towards their savings at the start. Second, gradual increases in contribution rates, especially timed with increases in income, could help people to reach a higher, more realistic retirement savings level. Third, there does exist an argument for a publicly-run kiwisaver scheme in competition with the current private ones, although the argument rests more on economics than cognitive psychology.


The graph shows the total payments made for each financial year since the year ending 2008. Payments have continued to climb with membership since the scheme started.
In their book Nudge: Improving Decisions About Health, Wealth, and Happiness, Thaler and Sunstein argue that human cognitive biases prevent us from behaving in ways conducive to our own best interests, and that often – particularly in an economic system based around homo economicus, or purely rational beings, operating in a free market – we have outcomes that are less than optimal for both individuals and for society. It is well recognized in cognitive psychology that we have a tendency toward making cognitive errors in particular defined ways. Thaler and Sunstein’s argument is that where possible, economies and societies should be redesigned in such a way that – without preventing people from making their own choices – it becomes easier for people to make good choices and easier to avoid making bad ones.
One simple example of this kind of design can be found in retirement schemes like New Zealand’s kiwisaver. The kiwisaver scheme gives employees an immediate 250% return on their investment and continued return until they retire, leading many personal finance advisers to describe joining the scheme as a “no-brainer”, despite the fact that law prevents savers from taking their money out of their kiwisaver account until they reach retirement age. If people starting a new job are, by default, outside the scheme and must opt-in to take advantage of it, they have the freedom to decide whether to invest in the scheme or not, but doing nothing will leave them out of it. On the other hand, if people starting a new job are, by default, inside the scheme, but can opt-out if they wish, people still have freedom to decide whether to belong to the scheme, but doing nothing will allow them to take full advantage of the scheme. In each case, individuals must implicitly or otherwise make a choice about belonging to the scheme; in each case, individuals have the freedom to decide whether they’d like to invest in the scheme or not; but the latter case will lead to much more money saved in kiwisaver and likely much more funds available to people when they retire.
Thaler and Sunstein’s helpful (if slightly contrived) mnemonic NUDGES describes what they believe “choice architects” can do to design better choices for people:

  •  iNcentives
  • Understand mappings
  • Defaults
  • Give feedback
  • Expect error
  • Structure complex choices
The current structure of kiwisaver results from the usual mix of opposing ideals and political decision-making from New Zealand’s Labour government from its introduction to 2008 and then the National Party government from 2008 until the present. But the question can be asked whether the system measures up to the standards described by Thaler and Sunstein’s “NUDGE” mnemonic.
Immediate financial incentives have in some form been present in the scheme since its inception. Although kiwisaver savers potentially accrue a return at market rates throughout the life of their investment, a special bonus is obtained immediately at the outset. First, government offered an initial “kick-start” payment of $1000 when individuals join the scheme. Second, government and employer subsidies are added at the same time individuals contribute to their scheme. This last feature has been tweaked a number of times since 2007; the National government reduced required employer subsidies from a maximum of 4% to 2% in 2009, but more recently raised those subsidies to 3%, while lowering the government subsidy. The extent to which financial incentives such as these operate as real psychological incentives is questionable, and there may have been better ways to incentive participation in the scheme using more immediate awards. Thaler and Sunstein explicitly used Kiwisaver to point out the questionable power of purely economic incentives (relative to intelligent defaults). Despite the $1000 kickstart offered by the government for kiwisaver, after merely six months, the automatic enrolment for people starting new jobs was the main method of enrolment, despite the kickstart enticing people to join through active enrolment [3]. If more immediate incentives are more powerful, perhaps a “rewards” scheme, as is popular with credit card accounts, may be more cost-effective. Although less government money goes into the scheme, more immediate incentives could be more powerful and ultimately lead to more money in the scheme altogether. However, such “bribes” have their own problems; they could undermine the extent to which the scheme is taken seriously. The kickstart also functions as a direct investment in each individual’s retirement fund.
People should be able to understand mappings of choice labels and descriptions into outcomes. Too often, choice presentations and labels do not easily and intuitively suggest outcome. Understanding mappings in choices with kiwisaver could be a significant challenge for potential savers. Individuals must choose between an array of index-tracked and actively managed funds without necessarily understanding how funds are invested. In fund promotional brochures, past fund performance is always indicated next to a disclaimer Past performance is no indication of future returns, leading consumers to either rely on them anyway or wonder about the point of such indications. Scheme providers such as the ASB Bank describe their own schemes using labels describing points in a continuum from “Conservative” to “Growth”. Still, only a few schemes (the Gareth Morgan Scheme is one exception) allow investors to see exactly which stocks and bonds their money is invested in, which might constrain the ability of more financially-literate investors to make their own best possible choices about funds in which to invest.
The power of an intelligent default opt-in for enrolling members in kiwisaver has been described above. A default opt-in could have opted in all employees, with an option to opt-out if they wished, and would have seen even more powerful results. This kind of automatic opt-in could still be applied at present, though it does seem that the majority of working-age New Zealanders are now in the scheme. However, Thaler and Sunstein extensively discussed examples of setting intelligent defaults for investors’ contribution level and the scheme into which they’re enrolled. Thaler and Benartzi’s successful “Save More Tomorrow” private savings scheme enrolls members at an initial low rate – say, 1% - and increases members’ rate in sync with their pay rises. In that way, members commit to very little in the short term, making the scheme easier to start, but in the long term, build a worthwhile savings rate and never have to adjust to a lower income as a result. In a company where the scheme was tried, just 25% of employees increased their contributions rate by 5% when recommended to by an advisor, but 78% of those who declined agreed to the “Save More Tomorrow” gradual rate increase scheme. Three years later, while the first group were contributing an average of 9% to their savings scheme, the second group – initially contributing just 1% - were contributing 13.6%, very close to the 15% recommended as optimum for the whole group by advisors. Apparently the plan has caught on, because by 2007, 39% of large employers in the USA were reported to use some variant of automatic rate increase.
Further default setting concerns for retirement funds include appropriate exposure to risk (high-growth, high-risk investments for people far from retirement, to low-growth, low-risk investments for those about to retire) and choosing a particular default fund. Thaler and Sunstein explained that Sweden’s privatized social security model, introduced last decade, allocated members to a carefully chosen, government run scheme, run in the model of Sweden’s previously successful government funds, if they failed to pick one for themselves. It turned out this scheme performed better, than the average of schemes chosen by savers themselves. In the New Zealand system, when a new member joins kiwisaver, if employers do not choose, rather than allocating the member to a carefully chosen scheme, government randomly allocates members [4] to one of a group of several private schemes chosen by the government. Such random allocation, while relying on private schemes, blunts market competition for quality, an essential part of any privately-run investment offering. Care should be taken when encouraging members to choose their own scheme, as members don’t necessarily choose better than a well-designed default; any default should avoid the kind of market inertia which could arise from randomly allocating members to private schemes. Morningstar’s most recent Kiwisaver Performance Survey report [5] named 5 best-performing kiwisaver providers over the previous 3 years or 5; none of these schemes were government defaults; though the report doesn’t mention any impact which management fees might have on investor returns. One might wonder whether private, government-appointed default scheme providers have less incentive to provide well-performing schemes.
Feedback for kiwisaver schemes might include clear and transparent information about returns and management fees. Savers ought to be able to easily compare and choose competing schemes. As this article is primarily focused on human factors related to kiwisaver, it’s beyond the scope of this article to examine deeply the way that different schemes can vary. Successive governments have tweaked kiwisaver disclosure rules.
Kiwisaver schemes are designed with some kind of expectation of error, at least in terms of potential mistakes made by clients and managers. Rules specify who is qualified to give different kinds of kiwisaver advice – as I write, the New Zealand Herald reports those rules have just been relaxed somewhat, though apparently only temporarily [6].
Structuring complex choices is the other topic Thaler and Sunstein discussed extensively with regard to government savings schemes. Investment experts know a number of facts not well understood by many kiwisaver savers, from basic principles like “diversifying”, to appropriate exposure to risk, to expert opinion in judging performance of investments. Currently the sheer number of schemes offered across all providers makes for very complex decisions on the part of savers. Savers need to be given an easy, clear, process to choose the scheme that is best for them, taking into account issues such as risk profile.


Inevitably, design of government-run savings schemes will be influenced by political realities. There are also practical constraints, such as the level of government and employer contributions deemed wise. Other legitimate debates exist about the merits of individualized savings schemes such as kiwisaver compared to schemes provided for by general taxation and paid out at a specified rate, such as New Zealand’s current Superannuation system. But within the constraints of an individual contribution system, where the amount paid out is determined by the amount invested and market returns, there remain a number of ways in which the system can be improved. These include tweaks to government incentives, a graduated, automatic, and optional rise in contribution rate with rises in income, and close scrutiny of default plans with consideration of a publicly-run option.


[1] Dwyer, M. (2009) The Place of Kiwisaver in New Zealand’s Retirement Income Framework. http://www.cflri.org.nz/sites/default/files/docs/RI-Review-2013-KiwiSaver.pdf, p6. Retrieved 18 August 2013.
[2] Douglas, C. (2013) KiwiSaver Performance Survey June Quarter 2013. http://www.morningstar.co.nz/s/documents/KiwiSaver-Survey-30-06-2013.pdf. Retrieved 18 August 2013.
[3] KiwiSaver evaluation reports: KiwiSaver Six-monthly report 1. http://www.ird.govt.nz/aboutir/reports/research/report-ks/research-ks-2007-12-31.html. Retrieved 18 August 2013.
[4] KiwiSaver: Choosing your KiwiSaver scheme. http://www.kiwisaver.govt.nz/new/providers/
[6] David Chaplin, The New Zealand Herald, 15 August 2013. “Code on the road - new rules for advisers” http://www.nzherald.co.nz/david-chaplin/news/article.cfm?a_id=616&objectid=10912346. Retrieved on 16 August 2013.