Wednesday, May 13, 2015

Mainline churches lose more members than evangelicals and Catholics, while Catholics gain very few new believers

The new Pew survey on religion in the United States found America's unaffiliated population boomed from 16 to 23% between 2007 and 2014; the Catholic population declined from 24% to 21% and Mainline Protestants declined from 18% to 15% of the population. In contrast, evangelicals almost held steady, going from 26% to 25%, and historically Black churches, whose members generally identify as evangelical, also held steady at 7%.

Pew writes:

"While the mainline Protestant share of the population is significantly smaller today than it was in 2007, the evangelical Protestant share of the population has remained comparatively stable...As a result, evangelicals now constitute a clear majority (55%) of all U.S. Protestants."

So why are Evangelicals holding steady? I can think of two explanations:
  1. Evangelicalism is more distinct from being unaffiliated; there are higher barriers to moving in and out of evangelicalism and so people are less likely to leave. The fact it's a form of Christianity that generally holds its members to stricter, more traditional standards than, at least, mainline churches, could bolster their sense of belonging and its distinctive value from being unaffiliated. Looking at mainline churches, they might ask, "If your church doesn't require anything special or distinctive from Christians, what's the point?"
  2. Evangelicals lose as many members as Catholics and Mainlines, but they make up for it by gaining members, too. So, Evangelicalism's stricter standards don't seem to be holding members in; but on the other hand, evangelical churches do seem to be more capable of attracting new members to make up for the members that they along with the other churches are losing.
We can look at Pew's numbers; they published the following table:


At first glance it looks like the second explanation might be more plausible. 10% of all US adults weren't raised evangelicals, but joined an Evangelical church at some point, while 9% left an evangelical church having been raised evangelical. In contrast, mainline and Catholic churches lost even more adherents but more strikingly, only gained 2% and 6% of members between them.


But perhaps a better way to characterize each of these religious groups and how they relate to members is to measure who leaves and joins as a proportion of the church group rather than as a proportion of US adults. Fortunately that's just a little bit of simple math. Rearranging the figures on the above table, we get:


Here, the numbers change a little. Evangelical churches are similar to Catholic churches in that they've both lost around 40% of their members to other groups. Both church groups are losing fewer members than mainline churches, who lost almost 60% of the proportion of people raised in mainline churches. But evangelical churches are similar to mainline churches in that both groups pick up quite a few members from other traditions, unlike the Catholic church, which picks up very few new members. Evangelicals' combination of gaining quite a few new members and losing quite a few contrasts with mainline churches, who gain members but lose even more, and Catholic churches, which lose as many as the others and gain very few.

How does this reflect on the groups? The Catholic church seem unattractive to outsiders, either because they don't actively work so hard to convert others, have high entry barriers, or are just not appealing to people raised in other groups. Mainline churches are reasonably attractive to outsiders (more than half of whom are coming from evangelical or Catholic churches rather than unaffiliated) but lose over half of the members raised in their groups. Evangelical churches have both a moderate level of joining (principally from the other churches, not from people raised without religion) but also lose a moderate number of believers to other groups. As a whole, it seems around half of people leaving various Christian groups are not joining other Christian groups, though we can't tell from these numbers which Christian groups tend to go unaffiliated rather than to other Christian groups.

So, in summary, relative to mainline churches, it seems like conjecture (1) above is true of Evangelicals: people are less likely to leave the Evangelical church than mainline churches. But relative to the Catholic Church, (2) is truer: people do leave, but many more people join the Evangelical church compared to the Catholic Church, suggesting Evangelicalism is not better at holding on to members than the Catholic church, but is especially good at attracting new ones.

All that said, the most striking image from the graphs is the change of the unaffiliated groups. About 40% of people who are raised without religion tend to join one, a similar proportion of people who are raised evangelical or Catholic who change their affiliation. But simply because so few people were raised without religion, the proportion of people who are religiously unaffiliated now but were raised Christian is very high. Of people who aren't members of a religious group, across the ones who weren't raised in a religion and those who were, more were atheists or agnostics, and fewer said religion was even somewhat important to them.

Saturday, February 7, 2015

How straight people react to photos of straight, gay, and lesbian couples


  • Straight people rate photos of straight couples more highly than gay or lesbian couples
  • Researchers found neural markers that probably influenced the ratings
  • The ratings were strongly connected to the raters' general Attitudes Toward Lesbians and Gay Men
  • Spending time with gay and lesbian people seemed to positively influence the ratings they have the gay and lesbian photos
  • What does it mean?
The gay rights movement has made huge strides in the last couple of decades. Here in the United States, state after state are currently removing prohibitions on legal recognition of same-sex marriages. Yet as of the time of publication, many states still prohibit same-sex marriage. If attitudes toward racial minorities is anything to go by, even after formal discrimination in law is removed, other forms of discrimination are likely to linger on.


"Social categorization" is the term social psychologists use to describe humans percieving each other as members of social groups rather than as individuals. It's a very natural and human thing to do. Without some kind of social categorization, we would know a lot less about anyone we haven't met and got to know personally and it would be much more difficult to interact with strangers! But it's clear that this process also underpins prejudices and therefore discrimination against disadvantaged minority groups.
Cheryl Dictker, Catherine Forestell, and Blakely Mulder at the College of William and Mary took at look at how heterosexuals responded differently to pictures of gay and lesbian couples, compared to pictures of straight couples. This would give them a way to measure biases that heterosexuals might have against gay and lesbian couples.


The researchers found some pretty definitive differences (Figure 1) in the way their heterosexual research participants behaved. They asked their participants to rate each picture they saw, and dismiss each photo to move on to the next when they'd made a judgment. You might expect that in today's society, people would want to avoid appearing prejudiced by giving a lower rating to gay and lesbian couples than straight couples. On the other hand, because participants were rating each individual couple photo independently, they mightn't have been able to make the right adjustments to compensate from automatic prejudice even if they were trying. In any event, participants rated gay couples as well as lesbian couples significantly lower than straight couples, and they also dismissed photos of gay couples faster than straight couples. Incidentally, women may have rated the gay couples even lower than men did. These ratings didn't seem to be just accidents related to the photos either. Participants took an Attitudes Toward Lesbians and Gay Men survey, and the lower their attitude was, the more negatively they rated the gay and lesbian couple photos.

Figure 1, from the article: "Reaction times to dismiss (top panel) and explicit ratings of (bottom panel) pictures of gay, lesbian, and straight couples. Error bars represent standard error of the mean."

The researchers also measured electrical activity in the brain (Figure 2). They examined signals known to appear when people view racial "out-groups", called "N1" and "P2" signals, and a signal that has been associated with negative judgments, the "LPP" signal. Participants had the "out-group" P2 reaction for gay couples more than straight couples1, and they also had the LPP 'negative judgment' signal more with gay and lesbian couples compared to straight couples.

Figure 2, from the article: "ERP amplitudes in response to pictures of straight, gay, and lesbian couples." The top image shows the "Fz" location with the N1 and N2 measurements highlighted, and the bottom image shows the "Pz" location with the P2 and LPP measurements highlighted.


The good news is that the more social contact with gay people participants said they had, and the more genuinely personal contact they had, the smaller the differences between ratings for straight couples and ratings for gay/lesbian couples were. There were some relationships between the electrical signals the researchers were tracking (N1 and P2 signals) and the proportion of GLBT friends and experiences with GLBT friends subjects had, although they weren't strong relationships and their statistical significance is questionable given the number of non-significant relationships. All might mean that as gay and lesbian couples become more visible in society, the bias against them will disappear, or at least decline. It's hard to know this for sure, though: do people with more positive attitudes towards gay and lesbian couples spend more time around them, or does spending more time around gay and lesbian people lead to the more positive attitudes?

It's notable that the clearest results from this study weren't from measuring electrical activity in the brain; they were from the ratings participants gave themselves, and from their reaction times. In particular, although there were some statistically significant correlations between electrical signals and the amount of social interaction with gay and lesbian people, they were weak and we probably couldn't draw any conclusions from them if the photo ratings hadn't indicated the same things so clearly. Additionally, of all the neural signals the researchers examined, only the LPP signal is clearly associated with negative judgments. The others tell us that participants thought the gay and lesbian couples were out of the ordinary, but not necessarily in a bad way. That's a good reminder that although neuroscience tools can be useful, the hype in the media might be out of proportion to their usefulness.

If this all sounds a bit depressing, we might also consider that people are capable of adjusting their implicit biases during overt actions. These tests are designed to see past those actions. For a society without prejudice, ideally no-one would have any unfair biases, implicit or explicit. But it also seems natural that straight people might relate better to photos of straight couples than gay or lesbian couples. As far as prejudice goes, we might get a long way simply asking people to be aware of their own biases and be willing to adjust for them. Studies like this remind us that, at least at present, the biases exist, and so it's important we consider how that might affect how people are treated.


1 The difference between lesbian couples and straight couples was in the same direction, but not statistically significant (p=0.10). Taken with the difference between gay couples and straight couples, it's probably reasonable to infer that with more participants, the researchers would have seen a result with lesbian couples, too.

Saturday, December 20, 2014

Black voters - especially conservatives - assume Black candidates share their political ideology

Voting is a notoriously fickle activity. And why wouldn't it be? Each voter gets only a tiny fraction of a percentage of a say in who their electoral representative will be and so it is unsurprising many voters will make a more automatic, intuitive judgment on their vote rather than through careful and time-consuming consideration of the costs and benefits to them or to the people at large.

Often we vote for people we think look like ourselves or seem like ourselves. When Mitt Romney, a Mormon, ran for president, evangelicals and atheists worried about whether he'd be suitable, while George Bush, an evangelical, drew his support from the evangelical community. Voters prefer an 'everyman' candidate who they can relate to – imagine having a beer with – to a candidate they might concede as more intelligent, but could seem out of touch. All of this might be completely rational – who better to represent your voice than a representative who thinks like you? Black Americans flocked to support President Barack Obama over his opponents – their support was essential, in fact, to getting him and keeping him in the White House. Only 39% of White Americans voted for Obama in 2012, compared to 93% of African Americans.

Berkeley researchers Amy Lerman and Meredith Sadin set out to understand why African Americans in particular have such a strong preference for African American candidates. It has been argued that Black voters prefer to give up being represented by someone who thinks like them in order to get a representative who looks like them. Lerman & Sadin wondered if that was accurate. Black voters considering a Black candidate see an in-group member; White voters, at least racially, see an out-group member. Group identities are important for everyone, and everyone sometimes uses stereotypes to judge others by group membership, in-group or not. This is especially true if we're making an automatic, intuitive decision as in the way many of us make up our minds about voting.

The researchers predicted several findings related to stereotyping Black candidates:
  1. White voters will stereotype a Black candidate as being more liberal than an identical White candidate, because of racist stereotypes about Black people or simply because they use a statistical probability heuristic.
  2. Black voters have a stronger racial identity than White voters, both because they are a numerical minority and because they're a particularly oppressed minority – more so than other racial minorities in America. Because of this, they'll project their own beliefs onto candidates more than both Whites and other racial minorities.
  3. Because statistically, Black candidates tend to be more liberal, Black conservatives will experience greater cognitive dissonance between wanting a candidate who represents their views, and one who looks like them. To cope with that, Black conservatives will use projection more than Black liberals.
  4. The degree to which a voter projects their views on a candidate predicts their likelihood of voting for that candidate.
The authors described a hypothetical candidate to over 3000 people. The description included a picture of the candidate, either as a Black or a White person. There were Black and White people who judged the candidates based on their race, but they tended to make those judgments in different ways.

In the sample of 3000 people with hypothetical candidates, Black people tended to judge the Black candidate as 'like them' ideologically. Black conservatives thought the Black candidate was more conservative then the White candidate, while Black liberal didn't significantly draw strong conclusions about the candidate from the candidate's race. In a subsequent analysis of the American National Election Survey, White Americans tended to stereotype their Black representatives as much more liberal than White representatives. Black Americans showed similar patterns to the sample of Black participants in the study sample. Going back to the question of what Black voters do when choosing between voting for a candidate who looks like them or a candidate with their political ideology, it seems like Black voters have their cake and eat it too: they tend to assume the candidate who looks like them has their ideology.

White conservatives judged White representatives as more conservative than they judged Black representatives.
White liberals stereotyped White candidates as more conservative than Black candidates.
Black conservatives thought Black candidates were more conservative, preferred them, and were more likely to vote for them.
Evidence unclear, but Black liberals perhaps more likely to vote for a Black candidate

While Black voters might not prefer a Black candidate simply because they share skin color, they do perceive Black candidates as more ideologically similar to them and are more likely to vote for the Black candidate compared to a White candidate. This was most true for Black conservatives. If this holds out in the future and in the population at large, it might imply that Black candidates, particularly liberal Black candidates, can take advantage of support from Black voters regardless of whether their ideology matches up with the people they represent.

In follow-up studies, the authors applied their analysis to Latinos – but for whatever reason, the effects they saw in the Black population didn't transfer to the Latino grouping. A lot of Latinos self-identify as White and the grouping may be less cohesive than the Black racial grouping. So whether the results apply to minorities in New Zealand like Maori, Pacific or Asian ethnic groups could be the subject of future research.

Sunday, September 28, 2014

Low voter turnout, a landslide for National, and a lack of good alternatives are probably all linked

77% of New Zealanders turned out for our recent election. In many countries, 77% would be an awesome turnout; in NZ, it's one of our worst results in 100 years (only 2011 and 2002 were worse).

So, why didn't New Zealanders vote?

Demographics be the first answer to try. Which group of New Zealanders didn't vote? Of course non-voters might have different hypothetical preferences to people who fit in similar demographic boxes, but who are voters. But it might give us some idea. Statistics NZ is likely to be collecting that kind of data. In the past, it's been less-educated, younger, and non-white ethnic groups that have less of a say.

Alternatively, we could ask people why they didn't vote. Statistics NZ did that last time around, and this is what they found:
  • 64% of non-voters had considered voting in this Election.
  • 43% of non-voters decided on Election Day that they would not vote.
  • 41% of non-voters put just a little thought into whether or not to vote, and 29% didn’t think about it at all.
  • The main overall reasons for not voting were that they had other commitments (14%) or work commitments (9%), could not be bothered voting (14%), couldn’t work out who to vote for (11%) and that their vote would not make a difference (8%).  
  • 33% of all non-voters agreed ‘I don’t trust politicians’ was an important factor (4 or 5 out of 5) on their not voting.  Other important factors were ‘it was obvious who would win so why bother’ (31%), and I’m just not interested in politics (29%).  Since 2008 there has been an increase in the proportion of non-voters saying ‘it was obvious who would win so why bother’ (from 19% to 31%).
A number of these reasons seem to relate to whether it's perceived there's a real choice voters can make. If:
  • the result seems predetermined
  • one side seems particularly appealing
  • the other side seems particularly unappealing
  • there doesn't seem to be much real difference between the candidates/parties
we might expect turnout to be lower.

Does this bear out across previous elections in New Zealand?

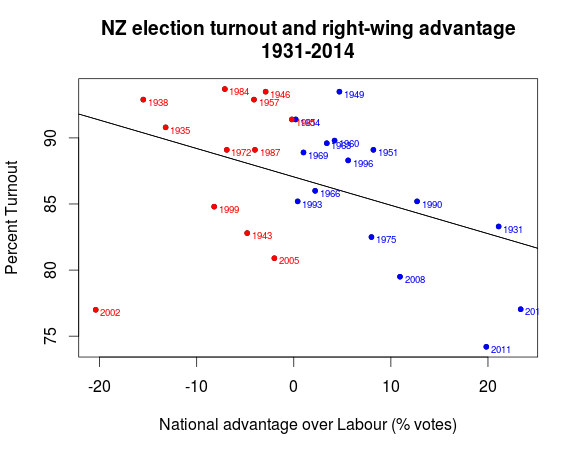
We can look at the margin between the two sides to see whether more people turn out to vote when there's a very close election, compared to when there's not much of a real choice.

The graph above shows the percentage turnout for each election between 1931 and 2014, excluding 1978 when data was not available. Elections with a National advantage are shown as a blue dot; elections with a Labour advantage are shown as a red dot. There does seem to be a significant trend apparent: the greater the margin between political parties, the lower the turnout (ρ[43]=-.41, p=0.033). So it seems like turnout has something to do with whether voters thought there was a genuine contest.

Does this effect seem to work on Labour supporters more than National supporters? Maybe National voters are habitual voters who reliably turn out every election, while left-wing voters only really come out if they can see a party worth supporting, a genuine choice, and a genuine chance of winning. We can take a look at the data above from a different angle:


The graph shows elections between 1931 and 2014, excluding 1978 where data wasn't available. National wins (those with “advantage” greater than 0, on the right side) are shown with a blue dot. Labour wins (those with “advantage” less than 0, on the left side) are shown with a red dot. It looks as if when turnout gets worse, National does significantly better in elections (r[43]=-.41, p=0.035).

So what does it mean? It seems like as the gap between the percentage of votes for each of the major parties increases, turnout gets lower. It's hard to say which direction the effect is in, but it does seem like voters for the losing side just doesn't turn out. Also, that effect might apply more when Labour's losing, because in general, National does better when turnout is low, while Labour does better when turnout is high.

If this pattern applied for the last election, where turnout was among the lowest ever, then the low turnout, and National's MMP 'landslide', is at least in part due to the lack of choice voters felt. Maybe it seemed like the outcome was inevitable. Or, voters didn't think Labour represented a real alternative – either because they weren't much different from National, or they didn't seem to be a better government than National, due to policy or leadership or some other reason.

If this election was generally like past elections, then low voter turnout, a landslide for National, and the lack of good alternatives are probably all linked.


Sources
http://www.elections.org.nz/events/past-events/general-elections-1853-2011-dates-and-turnout
http://www.elections.org.nz/news-media/preliminary-results-2014-general-election
Raw data and statistical analysis code is available on request.

Thursday, July 24, 2014

Voter turnout

Psychologists and political scientists have studied voter turnout and identified social pressure and identity as some of the strongest factors which can be changed to influence people to vote. In New Zealand, voter turnout in 2011 since before voting was extended to women in 1893!

Voter turnout varies a lot from one election to the next and can be quite important in determining election outcomes. Changes in voter turnout can be much larger than the margin by which a new government wins office. For instance, in the New Zealand general election in 2011, the governing and supporting parties (National, Maori, ACT, and UF) won 93,939 more votes than the opposition parties (Labour, Greens, NZ First, and Mana) in Parliament [1]. Turnout had dropped from 79% in 2008 [2] to only 74% in 2011, which was an absolute difference of 177579 extra voters who were eligible to vote and didn't – in other words, if just the voters who had voted in 2008 election had all voted in 2011 (not including the 20% of eligible voters who didn't vote in either election), they could have changed the election outcome!


Party group Votes
Government (National, etc) 1127950
Opposition (Labour, etc) 1034021
Difference 93929


Year % Turnout Non-voters
2008 79% 614279
2011 74% 791858

-5% -177579


This makes turnout potentially an important decider in elections. Historically, political campaigners know this and have spent a lot of energy either trying to convince people to vote in Get out the Vote campaigns, or - arguably - trying to discourage people from voting with poll taxes, voter ID laws, etc.

Behavioral researchers have examined the design of elections and how the design of an election could encourage or discourage people to vote, and also tactics which political campaigners might be able to use to encourage people to vote.

Exploring social influence: Bischoff & Egbert [3] wrote about how people choose a candidate, not about turnout in general, but the principles could apply to deciding whether to vote at all, as well as deciding to vote for a particular candidate. People might look to others in their social group or other people like them as a guide for picking the best candidate, particularly if they're not confident of being good judges at that. People could also follow their peers not because they necessarily thought their peers were good at picking good candidates but simply to fit in with their peers. People might also want to vote for the candidate they thought would win, regardless of whether they really preferred the candidate because either they just want to reduce uncertainty or to reduce future anxiety from seeing their candidate lose and having to confront the idea the “worse” candidate won.

Identity as a voter: Christopher Bryan and colleagues [4] at UC-Irvine found they could influence voting by surveying voters about “being a voter” or simply about “voting”. They thought that a person's identity is important to them, that in general, people believe voting is a positive thing or a moral good or at least a civic duty, and so that if they prompted people to think about voting as an identity “being a voter”, people would prefer to claim that identity for themselves in order to improve their image or their identity. Conversely, if people were asked about voting, they'd be less likely to think of being a voter as an identity and so being motivated to improve their image and identity wouldn't lead them to vote. People actively manage their self-concepts and try to improve it by doing things which improves their self-concept – if surveyors suggest that “being a voter” is relevant to an identity, it becomes more relevant to participants' self-concept.

Social pressure also seemed to help – a little bit. In elections in New Jersey (2005) and California (2006) [5], people were given information over the phone either that voter turnout was low and declining, or that it was the highest it has ever been. They were later given a survey asking them about their likelihood of voting. Across the two experiments, prospective voters were on average about 4% more likely to say they would definitely vote when they were told voter turnout was at record highs than when they were told it was declining.

Another study [6] didn’t find that telling people about turnout in their own community influenced turnout, but reminding people that their vote was a matter of public record – displaying whether they voted previously – did significantly improve turnout. Even thanking voters [7] for voting via a mailout produced a significantly higher turnout in the next election, compared to voters who got a generic reminder mailout which didn’t thank voters for voting previously.

Self efficacy and socioeconomic status: One unexpected finding came from a study [8] comparing 18 and 19 year old first-time voters, split into two groups depending on whether the voter had a mother who graduated from high school. It seems like a strange thing to look at, but researchers used mother’s education as a general, rough measure of someone’s socioeconomic status. It turned out that 43% of young people with a high school graduate mom turned out to vote while only 29% of young people whose mom didn't graduate came to vote on the day. The same study found 'general self efficacy' predicted how likely young people were to vote, especially when they came from those disadvantaged backgrounds. 'General self efficacy' is a measurement of how much people agree with general statements like:

I can do just about anything I really set my mind to.”

I can solve the problems I have.”

Only about 2 of every 10 young people from those disadvantaged backgrounds voted if they were in the lowest 25% on the self efficacy scale, but that proportion rose to 3 or 4 in 10 for the highest 25% on the self-efficacy scale. From 2 to 3 or 4 out of 10 might sound like a fairly small increase but it represents an increase in turnout by an extra half or even doubling of the low-efficacy group.

This leads to an open question – is efficacy something we can induce in prospective voters in this case? Not only does it increase turnout, but stronger efficacy in general seems to be particularly helpful for young people from disadvantaged backgrounds. So finding ways to increase efficacy – even if it is domain-specific to voting – could be particularly effective in addressing social disparities in voter turnout.

It's really striking how much intergenerational influence could potentially affect an entire generation’s ability to have their civic voice heard in elections.

Voter turnout is a problem of motivation and a desire to change an election outcome, in itself, might not be the most powerful motivator to vote for an individual. Many voters probably understand that individually, their vote is highly unlikely to change the outcome of an election, yet because of social norms about voter civic duty, social pressure, peer influence, and gratitude and other psychological factors which can be influenced by even by a voter’s mother’s education, can play a part in getting voters out to vote. Getting voters to vote as a way to make a statement or feel good about participating in a civic duty may be a much more effective way of motivating voters than simply informing them of the issues at stake.

References

[1] http://www.electionresults.govt.nz/electionresults_2011/e9/html/e9_part9_1.html
[2] http://www.electionresults.govt.nz/electionresults_2008/e9/html/e9_part9_1.html
[3] Bischoff, I. & Egbert, H. (2013). Social information and bandwagon behavior in voting: an economic experiment. Journal of Economic Psychology, 34:270-284.

[4] Bryan, C. J., Walton, G. M., Rogers, T., & Dweck, C. S. (2011) Motivating voter turnout by invoking the self. Proceedings of the National Academy of Sciences of the United States of America. doi:10.1073/pnas.1103343108.

[5] Gerber, A. S., & Rogers, T. (2009). Descriptive social norms and motivation to vote: Everybody’s voting and so should you. The Journal of Politics, 71(1), 178–191.

[6] Panagopoulos, C., Larimer, C. W., & Condon, M. (2013). Social pressure, descriptive norms, and voter mobilization. Political Behavior: doi:10.1007/S11109-013-9234-4.


[7] Panagopoulos, C. (2011) Thank you for voting: gratitude expression and voter mobilization. The Journal of Politics, 73(3):707-717.

[8] Condon, M. & Holleque, M. (2013) Entering politics: general self-efficacy and voting behavior among young people. Political Psychology, 34(2): ddoi: 10.1111/pop.12019.


Thursday, September 12, 2013

Would our world be more peaceful if women were on top?


Would our world be more peaceful if women were on top? That’s a question a number of people have asked in recent times. Given the New Zealand Labour Party's recent controversy on equalising the representation of women within their party, the question seems like it might be particularly topical in New Zealand right now. Men are aggressive, impulsive, and love a good fistfight, while women are caring nurturers who value relationship...or so the stereotypes tell us. Stephen Pinker in his book The Better Angels of Our Nature notes that more violent areas of the world happen to be those which lag behind others in the empowerment of women. Micah Zenko at foreignpolicy.com thinks women are less inclined to start wars, but Rosa Brooks at the same site thinks women can get tough and aggressive just like men can. In this post I outline some of the more general knowledge gathered about what ordinary women and men think about war, and then make a little preliminary analysis on what men and women in power think about war – which might be the real determining factor here.

This Pew Research study got people talking about the issue recently. Pew Research asked men and women all around the world whether or not they approved of Obama’s drone strike program. There was a large difference between countries. 61% of Americans approved of the program, but only 43% of Ugandans and 21% of Spaniards. But there was also a large and consistent gender gap. Of the countries listed in Pew’s report, the discrepancy was largest in Japan, where 41% of men but only 10% of women approved of drone attacks. But the gap was everywhere – in Australia, almost twice as many men (58%) as women (30%) approved of drone strikes, and in the US, where approval was the highest, a staggering 70% of men approved of the strikes, though only just over half (53%) of women did.

Looking at that gender difference on military force more generally, Micah Zenko’s article enumerated an impressive list of how often men in the USA as well as around the world seemed to be particularly fond of use of force in pretty much all the major wars the US has fought over the last 20 years. Eichenberg [1] published a comprehensive study looking at gender differences in use of force in 486 different survey questions in the US from 1990 to 2003. He found that American men are more likely to support military force for any purpose more than American women are. Looking at the justifications that were given for each military intervention in question and the kind of military force, men didn’t seem to be so concerned about humanitarian issues and loss of life.

Despite all this research into what ordinary men and women think, gender differences in the ordinary population mightn’t tell us anything about what women and men in power do with their power. Just as the surveys found that the gender gap between men and women wasn’t the same right across the world – it seems to be stronger in some countries than others – groups of women and men within a country might differ. The kind of people who get selected to be politicians might be the more aggressive, bellicose types we associate with masculinity rather than feminity. Maybe that kind of aggressive, bold personality is just the type needed to succeed in politics and gain positions of power. If women eventually get to make up 50% of the US Congress, of Parliaments around the world, it might be because women manage to catch up and become just as aggressive as men already are. If that’s the case, then more women in power through more aggressiveness isn’t going to make the world any more peaceful. Maybe there’s a simple psychological trait called something like ‘aggression’, which men have more of, which makes men more likely to support war and more likely to get political power than women. In that case, we could expect the few women who make it into politics are the kind of women who have more aggressive, masculine attitudes and consequently, women in power already are no more aggressive than men in power.

Men and women in power

To test this, I took a look voting records of men and women in the US Congress and how they voted on authorization for the US war in Iraq in 2002, and for supporting the use of force in Libya in 2011. When I looked at Iraq, the difference seemed to be clear. There were only 12 out of 100 senators who were woman at the time, so it’s not even worth looking at data in the Senate. But in the house, the data were interesting and seemingly clear:

Men vs. women in Congress voting for military action against Iraq in 2002

Percentage of men and women in the House of Representatives who voted to pass the Bill To Authorize the Use of United States Armed Forces Against Iraq. Voting records: Clerk of the House of Representatives.

But the first thing to remember is that US Democrats tended to oppose the war, not only on ideological reasons but also because it was the opposing Republican President, George W. Bush, who was advocating for war. That could skew the results, because while just 20% of congressional representatives in the Democratic Party were women, just a tiny 7% of Republican representatives were women. So it’s worth looking at those differences for each party:

Men vs. women in Congress voting for military action in Iraq in 2002, by party
Percentage of men and women Democrats and Republicans in the House of Representatives who voted to pass the Bill To Authorize the Use of United States Armed Forces Against Iraq. Voting records: Clerk of the House of Representatives.

Although there were large differences between each party, certainly a larger proportion of male Democrats (44%) than female Democrats (20%) voted to authorize force. The sample of female Republicans – just 15 – is really too small to make any statement. Thinking back to our original question – what if women were in charge? – it might be interesting to see what would have happened if all men voted along the same proportions that women did:
Military action
No military action
169
260

 In this comparison, “No military action” wins, 260 votes to 169. If, in 2002, men in congress had voted the way women in congress did, the Iraq war would never have happened! But we need to remember the difference between the parties reflects how the wider population choose their leaders. Presumably the vote that determined who got into Congress also chose Republicans for their policies, and Democrats for theirs. So we could look at how the vote would have been if men overall had voted the same way women in their own party did:

Military action
No military action
Republicans
204
15
Democrats
41
167
Total
245
182

In that case, military action would still have won out, 245 votes to 182, though the margin would be slimmer (57% to 43%) than it actually was in history (73% to 39%). When we consider the way that people voted for political parties, and that party membership probably tells us as much or more about the way a congressperson votes than their gender, it looks like that there’d still be enough bellicose women around to join with the men in taking the US to war.

Results were even more mixed when the US Congress came to vote on supporting Obama in an air strike on Libya:
Men vs. women in Congress voting for military action in Libya in 2011
 Percentage of men and women in the House of Representatives who voted for the Bill Authorizing the limited use of the United States Armed Forces in support of the NATO mission in Libya. Voting records: Clerk of the House of Representatives.

This time, it appears superficially that women (42%) actually appeared to be more likely than men (27%) to support military action. But as before, the more meaningful figures seem to be tied up with party membership:
Men vs. women in Congress voting for military action in Libya in 2011, by party

Percentage of men and women Democrats and Republicans in the House of Representatives who voted for the Bill Authorizing the limited use of the United States Armed Forces in support of the NATO mission in Libya. Voting records: Clerk of the House of Representatives.

It seems like the reversal had a lot to do with party membership. When a Republican President wanted to go to war in 2002, the Republican party were more likely to endorse the war. Similarly, when a Democratic President wanted to go to war in 2011, the Democrats were more likely to support him. The majority of Congresswomen are Democrats, so that made women appear to be more supportive of war. Looking at the difference between men and women Democrats (again, there are too few Congressional Republican women to really make a judgment), there was very little difference between male and female.

So would the world be more peaceful if women were on top?

Women tended to more strongly oppose the War on Iraq in 2002 than men did. But there could be a number of explanations for that. Maybe more liberal congressional districts were more likely to elect female Congressional representatives, and also – independently - more likely to elect doveish representatives. To test this, we’d need to somehow measure how liberal each district is. Dividing Congress into Democrats and Republicans is a good start, but since there’s a lot of variation in each party, we should look more carefully at the attitudes toward war that Congressional Districts who elect Congressmen and Congresswomen have.
Women were also at least as likely to support the use of military force to support the NATO mission in Libya in 2011.  That might hint at the difference Eichenberg found in women’s support for causes justified on more humanitarian grounds.

This seems like a good start. Of course there were a whole lot of wars fought over the last 20 years, and not only the US Congress but legislative bodies around the world voted on them. If we take a larger look at those voting records, we might see a pattern emerge, where at least for a certain kind of war, women tend to be a lot more peaceful than men.

One of the main objections to the argument that more women in power would make the world more peaceful is that, if more women were voted in, it would be because women somehow became more like men, in becoming more aggressive or masculine or taking on other traits that make them more likely to survive in politics and more likely to support war. But when we consider a quota system like the New Zealand Labour Party has sought to introduce, the effect might be quite different. Under a quota system in present-day society, even though women would make up 50% of representation, we still live in a society where the data seem to suggest women in general show greater concern for loss of human life and humanitarian concerns [1]. Although a quota system has been derisively labelled as a 'man-ban' by critics and the media, it might actually - in some limited ways - produce a better outcome than if women representatives changed so that electorates voted in 50% of them even without a quota.


[1] Eichenberg, R. C. (2003). Gender differences in Public Attitudes toward the Use of Force by the United States, 1990-2003. International Security 28(1): 110-141.

Tuesday, September 3, 2013

Poverty even makes it tough to think properly

In public political debate there are those who want to blame the poor for their own poverty, perhaps characterizing them as lazy or lacking some other kind of character trait a person needs to earn money. Recently, celebrity cook Jamie Oliver generated controversy with a comment beginning with a disclaimer which tends to set off the alarm bells, “I’m not judgmental, but…” (uh-oh)
"I'm not judgmental, but I've spent a lot of time in poor communities, and I find it quite hard to talk about modern-day poverty. You might remember that scene in [a previous series] Ministry of Food, with the mum and the kid eating chips and cheese out of Styrofoam containers, and behind them is a massive fucking TV. It just didn't weigh up."The fascinating thing for me is that seven times out of 10, the poorest families in this country choose the most expensive way to hydrate and feed their families. The ready meals, the convenience foods." [1]

An article published in Science last week [2] described an experiment where people were asked to do a simple ‘which-shape-fits-in-the-blank’ task similar to some questions which might appear in IQ tests. They gave some good evidence that simply being poorer, having financial issues on the mind, can make it more difficult to perform on their test. It’s a nice demonstration that actually fits with the popular idea that in some way, poverty is a result of poor people’s behavior, while underscoring that a person’s behavior is affected by circumstance and being financially secure can make it easier to act smarter. Conversely, being financially vulnerable makes good decision-making harder and could potentially trap people into a cycle of poverty for which you can hardly blame them. The effect of financial vulnerability could be pretty strong; the experimenters compared the effects they found with other studies and suggested that “evoking financial concerns has a cognitive impact comparable with losing a full night of sleep”.

In an experiment with richer and poorer Americans, the experimenters asked each person a financial question first to get them thinking about money, which was “Your car is having some trouble and requires $1500 to be fixed. You can pay in full, take a loan, or take a chance and forego the service at the moment. How would you go about making this decision?” As a control, they repeated the same experiment but used $150 as the amount instead of $1500.  The experimenters say they expected that when the financial question involved $1500, the problem would be difficult for poorer participants but not for richer ones, although they expected no difference for the smaller amount (150). That’s exactly what they found – poorer people performed significantly (p<0.001) worse in the ‘fill-the-blank’ task than richer people did. They repeated the experiment without the financial question, to make sure people weren’t getting stressed out by larger numbers. Illustrating how bad performance in intellectual challenges might trap people into further poverty, the experimenters repeated the experiment, with similar results, where people were paid $0.25 per question they got right. The poorer people on average walked away from the experiment with 18% less than the richer people did, so in some way, even the experiment itself functioned to perpetuate and magnify the gap between rich and poor.

The experimenters wanted to make sure that the gap in between the rich and poor they saw didn’t just hold for the moment right after people face a tough financial decision. To do that they found that sugar cane farmers from Tamil Nadu in India struggled significantly more (p<0.001) with the ‘fill-the-blank’ tasks before harvest than after harvest, when they got paid and had fewer financial difficulties. The effect held no matter what time of year harvest occurred. Experimenters even collected heart rate and blood pressure as a way of measuring stress, and they found that even taking those factors into account, farmers still struggled more with the task before harvest. That showed that the effect they saw wasn’t fully caused by stress, at least as far as stress measured by heart rate and blood pressure is concerned. Though stress could have been a factor, the researchers thought that because an effect remained regardless of stress, the mere background cognitive demand on the farmers during hard financial times caused them to perform more poorly.


Is this even a new thing?

This study does a good job demonstrating a link between financial circumstances and cognitive ability. But it is far from the first to examine the nasty way poverty works as a catch-22 to trap people and stop them from getting ahead in the way we’d like to think people can in an egalitarian or meritocratic society. Childhood poverty seems to predict the size of people’s working memory, and mainly through chronic stress, i.e., child poverty is related to chronic stress and that chronic stress caused most of the relationship between poverty and a poor working memory as an adult [3]. IQ is even correlated worldwide with national GDPs, and when GDP rises, so do IQs, suggesting that access to money and resources helps determine IQ, not (or not only) the other way around [4].

So…?

Based on what they found, the study authors suggested that government work and income programs need to avoid adding stress and complexity to application processes for receiving income support or assistance in finding work. If beneficiaries are to be helped back into work, too much cognitive load spent thinking and worrying just about access to benefits might hinder their ability to find work. Government austerity measures which introduce new hoops beneficiaries must jump through to access government support might be intended to reduce the amount of money the government spends on income support. In the long run, the cognitive load effect observed in the study could work against such austerity measures, working to increase the amount of time it takes for people to find work and hence be dependent on government support.
More broadly, the new Science study shows that, where people in poverty are struggling to get ahead, poverty itself can prevent them from leaving poverty behind, through a harmful, though temporary, effect on intelligence. Thus, not only is it futile to blame this detrimental effect on someone’s cognitive ability on them, since it is outside of their control, the poverty effect could be relieved if only a person had relief from poverty and excessive financial concerns. Such a fact has substantial implications if we want to make our society any kind of egalitarian or meritocratic one in which the skills of every individual are fully realized for society as a whole.


[1] Deans, J. Jamie Oliver bemoans chips, cheese and giant TVs of modern-day poverty. The Guardian, 26 August 2012. Retrieved from  http://www.theguardian.com/lifeandstyle/2013/aug/27/jamie-oliver-chips-cheese-modern-day-poverty on 31 August 2013.

[2] Mani, A., Mullainathan, S., Shafir, E., & Zhao, J. (2013) Poverty Impedes Cognitive Function. Science 30 August 2013: 976-980. Retrieved from http://www.sciencemag.org/content/341/6149/976.on  on 31 August 2013.

[3] Evans, G. W. (2009) Childhood poverty, chronic stress, and adult working memory. Proceedings of the National Academy of Sciences of the United States of America 106(16):6545-6549. Retrieved from http://www.pnas.org/content/106/16/6545.long on 31 August 2013.

[4] Roiviainen, E. (2012) Economic, educational, and IQ gains in eastern Germany 1990-2006. Intelligence 40(6): 571-575. Retrieved from http://www.sciencedirect.com/science/article/pii/S0160289612000864 on 31 August 2013.