Saturday, December 20, 2014

Black voters - especially conservatives - assume Black candidates share their political ideology

Voting is a notoriously fickle activity. And why wouldn't it be? Each voter gets only a tiny fraction of a percentage of a say in who their electoral representative will be and so it is unsurprising many voters will make a more automatic, intuitive judgment on their vote rather than through careful and time-consuming consideration of the costs and benefits to them or to the people at large.

Often we vote for people we think look like ourselves or seem like ourselves. When Mitt Romney, a Mormon, ran for president, evangelicals and atheists worried about whether he'd be suitable, while George Bush, an evangelical, drew his support from the evangelical community. Voters prefer an 'everyman' candidate who they can relate to – imagine having a beer with – to a candidate they might concede as more intelligent, but could seem out of touch. All of this might be completely rational – who better to represent your voice than a representative who thinks like you? Black Americans flocked to support President Barack Obama over his opponents – their support was essential, in fact, to getting him and keeping him in the White House. Only 39% of White Americans voted for Obama in 2012, compared to 93% of African Americans.

Berkeley researchers Amy Lerman and Meredith Sadin set out to understand why African Americans in particular have such a strong preference for African American candidates. It has been argued that Black voters prefer to give up being represented by someone who thinks like them in order to get a representative who looks like them. Lerman & Sadin wondered if that was accurate. Black voters considering a Black candidate see an in-group member; White voters, at least racially, see an out-group member. Group identities are important for everyone, and everyone sometimes uses stereotypes to judge others by group membership, in-group or not. This is especially true if we're making an automatic, intuitive decision as in the way many of us make up our minds about voting.

The researchers predicted several findings related to stereotyping Black candidates:
  1. White voters will stereotype a Black candidate as being more liberal than an identical White candidate, because of racist stereotypes about Black people or simply because they use a statistical probability heuristic.
  2. Black voters have a stronger racial identity than White voters, both because they are a numerical minority and because they're a particularly oppressed minority – more so than other racial minorities in America. Because of this, they'll project their own beliefs onto candidates more than both Whites and other racial minorities.
  3. Because statistically, Black candidates tend to be more liberal, Black conservatives will experience greater cognitive dissonance between wanting a candidate who represents their views, and one who looks like them. To cope with that, Black conservatives will use projection more than Black liberals.
  4. The degree to which a voter projects their views on a candidate predicts their likelihood of voting for that candidate.
The authors described a hypothetical candidate to over 3000 people. The description included a picture of the candidate, either as a Black or a White person. There were Black and White people who judged the candidates based on their race, but they tended to make those judgments in different ways.

In the sample of 3000 people with hypothetical candidates, Black people tended to judge the Black candidate as 'like them' ideologically. Black conservatives thought the Black candidate was more conservative then the White candidate, while Black liberal didn't significantly draw strong conclusions about the candidate from the candidate's race. In a subsequent analysis of the American National Election Survey, White Americans tended to stereotype their Black representatives as much more liberal than White representatives. Black Americans showed similar patterns to the sample of Black participants in the study sample. Going back to the question of what Black voters do when choosing between voting for a candidate who looks like them or a candidate with their political ideology, it seems like Black voters have their cake and eat it too: they tend to assume the candidate who looks like them has their ideology.

White conservatives judged White representatives as more conservative than they judged Black representatives.
White liberals stereotyped White candidates as more conservative than Black candidates.
Black conservatives thought Black candidates were more conservative, preferred them, and were more likely to vote for them.
Evidence unclear, but Black liberals perhaps more likely to vote for a Black candidate

While Black voters might not prefer a Black candidate simply because they share skin color, they do perceive Black candidates as more ideologically similar to them and are more likely to vote for the Black candidate compared to a White candidate. This was most true for Black conservatives. If this holds out in the future and in the population at large, it might imply that Black candidates, particularly liberal Black candidates, can take advantage of support from Black voters regardless of whether their ideology matches up with the people they represent.

In follow-up studies, the authors applied their analysis to Latinos – but for whatever reason, the effects they saw in the Black population didn't transfer to the Latino grouping. A lot of Latinos self-identify as White and the grouping may be less cohesive than the Black racial grouping. So whether the results apply to minorities in New Zealand like Maori, Pacific or Asian ethnic groups could be the subject of future research.

Sunday, September 28, 2014

Low voter turnout, a landslide for National, and a lack of good alternatives are probably all linked

77% of New Zealanders turned out for our recent election. In many countries, 77% would be an awesome turnout; in NZ, it's one of our worst results in 100 years (only 2011 and 2002 were worse).

So, why didn't New Zealanders vote?

Demographics be the first answer to try. Which group of New Zealanders didn't vote? Of course non-voters might have different hypothetical preferences to people who fit in similar demographic boxes, but who are voters. But it might give us some idea. Statistics NZ is likely to be collecting that kind of data. In the past, it's been less-educated, younger, and non-white ethnic groups that have less of a say.

Alternatively, we could ask people why they didn't vote. Statistics NZ did that last time around, and this is what they found:
  • 64% of non-voters had considered voting in this Election.
  • 43% of non-voters decided on Election Day that they would not vote.
  • 41% of non-voters put just a little thought into whether or not to vote, and 29% didn’t think about it at all.
  • The main overall reasons for not voting were that they had other commitments (14%) or work commitments (9%), could not be bothered voting (14%), couldn’t work out who to vote for (11%) and that their vote would not make a difference (8%).  
  • 33% of all non-voters agreed ‘I don’t trust politicians’ was an important factor (4 or 5 out of 5) on their not voting.  Other important factors were ‘it was obvious who would win so why bother’ (31%), and I’m just not interested in politics (29%).  Since 2008 there has been an increase in the proportion of non-voters saying ‘it was obvious who would win so why bother’ (from 19% to 31%).
A number of these reasons seem to relate to whether it's perceived there's a real choice voters can make. If:
  • the result seems predetermined
  • one side seems particularly appealing
  • the other side seems particularly unappealing
  • there doesn't seem to be much real difference between the candidates/parties
we might expect turnout to be lower.

Does this bear out across previous elections in New Zealand?

We can look at the margin between the two sides to see whether more people turn out to vote when there's a very close election, compared to when there's not much of a real choice.

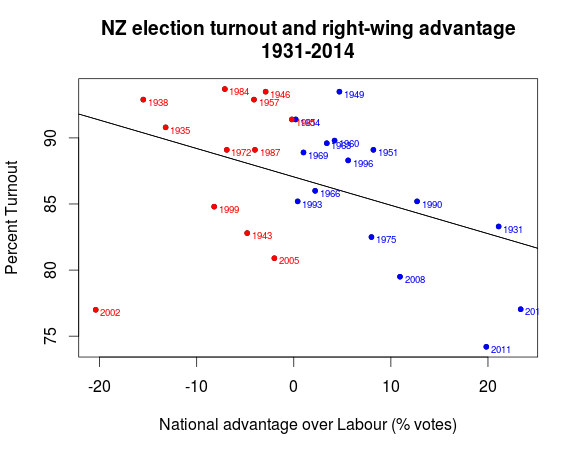
The graph above shows the percentage turnout for each election between 1931 and 2014, excluding 1978 when data was not available. Elections with a National advantage are shown as a blue dot; elections with a Labour advantage are shown as a red dot. There does seem to be a significant trend apparent: the greater the margin between political parties, the lower the turnout (ρ[43]=-.41, p=0.033). So it seems like turnout has something to do with whether voters thought there was a genuine contest.

Does this effect seem to work on Labour supporters more than National supporters? Maybe National voters are habitual voters who reliably turn out every election, while left-wing voters only really come out if they can see a party worth supporting, a genuine choice, and a genuine chance of winning. We can take a look at the data above from a different angle:


The graph shows elections between 1931 and 2014, excluding 1978 where data wasn't available. National wins (those with “advantage” greater than 0, on the right side) are shown with a blue dot. Labour wins (those with “advantage” less than 0, on the left side) are shown with a red dot. It looks as if when turnout gets worse, National does significantly better in elections (r[43]=-.41, p=0.035).

So what does it mean? It seems like as the gap between the percentage of votes for each of the major parties increases, turnout gets lower. It's hard to say which direction the effect is in, but it does seem like voters for the losing side just doesn't turn out. Also, that effect might apply more when Labour's losing, because in general, National does better when turnout is low, while Labour does better when turnout is high.

If this pattern applied for the last election, where turnout was among the lowest ever, then the low turnout, and National's MMP 'landslide', is at least in part due to the lack of choice voters felt. Maybe it seemed like the outcome was inevitable. Or, voters didn't think Labour represented a real alternative – either because they weren't much different from National, or they didn't seem to be a better government than National, due to policy or leadership or some other reason.

If this election was generally like past elections, then low voter turnout, a landslide for National, and the lack of good alternatives are probably all linked.


Sources
http://www.elections.org.nz/events/past-events/general-elections-1853-2011-dates-and-turnout
http://www.elections.org.nz/news-media/preliminary-results-2014-general-election
Raw data and statistical analysis code is available on request.

Thursday, July 24, 2014

Voter turnout

Psychologists and political scientists have studied voter turnout and identified social pressure and identity as some of the strongest factors which can be changed to influence people to vote. In New Zealand, voter turnout in 2011 since before voting was extended to women in 1893!

Voter turnout varies a lot from one election to the next and can be quite important in determining election outcomes. Changes in voter turnout can be much larger than the margin by which a new government wins office. For instance, in the New Zealand general election in 2011, the governing and supporting parties (National, Maori, ACT, and UF) won 93,939 more votes than the opposition parties (Labour, Greens, NZ First, and Mana) in Parliament [1]. Turnout had dropped from 79% in 2008 [2] to only 74% in 2011, which was an absolute difference of 177579 extra voters who were eligible to vote and didn't – in other words, if just the voters who had voted in 2008 election had all voted in 2011 (not including the 20% of eligible voters who didn't vote in either election), they could have changed the election outcome!


Party group Votes
Government (National, etc) 1127950
Opposition (Labour, etc) 1034021
Difference 93929


Year % Turnout Non-voters
2008 79% 614279
2011 74% 791858

-5% -177579


This makes turnout potentially an important decider in elections. Historically, political campaigners know this and have spent a lot of energy either trying to convince people to vote in Get out the Vote campaigns, or - arguably - trying to discourage people from voting with poll taxes, voter ID laws, etc.

Behavioral researchers have examined the design of elections and how the design of an election could encourage or discourage people to vote, and also tactics which political campaigners might be able to use to encourage people to vote.

Exploring social influence: Bischoff & Egbert [3] wrote about how people choose a candidate, not about turnout in general, but the principles could apply to deciding whether to vote at all, as well as deciding to vote for a particular candidate. People might look to others in their social group or other people like them as a guide for picking the best candidate, particularly if they're not confident of being good judges at that. People could also follow their peers not because they necessarily thought their peers were good at picking good candidates but simply to fit in with their peers. People might also want to vote for the candidate they thought would win, regardless of whether they really preferred the candidate because either they just want to reduce uncertainty or to reduce future anxiety from seeing their candidate lose and having to confront the idea the “worse” candidate won.

Identity as a voter: Christopher Bryan and colleagues [4] at UC-Irvine found they could influence voting by surveying voters about “being a voter” or simply about “voting”. They thought that a person's identity is important to them, that in general, people believe voting is a positive thing or a moral good or at least a civic duty, and so that if they prompted people to think about voting as an identity “being a voter”, people would prefer to claim that identity for themselves in order to improve their image or their identity. Conversely, if people were asked about voting, they'd be less likely to think of being a voter as an identity and so being motivated to improve their image and identity wouldn't lead them to vote. People actively manage their self-concepts and try to improve it by doing things which improves their self-concept – if surveyors suggest that “being a voter” is relevant to an identity, it becomes more relevant to participants' self-concept.

Social pressure also seemed to help – a little bit. In elections in New Jersey (2005) and California (2006) [5], people were given information over the phone either that voter turnout was low and declining, or that it was the highest it has ever been. They were later given a survey asking them about their likelihood of voting. Across the two experiments, prospective voters were on average about 4% more likely to say they would definitely vote when they were told voter turnout was at record highs than when they were told it was declining.

Another study [6] didn’t find that telling people about turnout in their own community influenced turnout, but reminding people that their vote was a matter of public record – displaying whether they voted previously – did significantly improve turnout. Even thanking voters [7] for voting via a mailout produced a significantly higher turnout in the next election, compared to voters who got a generic reminder mailout which didn’t thank voters for voting previously.

Self efficacy and socioeconomic status: One unexpected finding came from a study [8] comparing 18 and 19 year old first-time voters, split into two groups depending on whether the voter had a mother who graduated from high school. It seems like a strange thing to look at, but researchers used mother’s education as a general, rough measure of someone’s socioeconomic status. It turned out that 43% of young people with a high school graduate mom turned out to vote while only 29% of young people whose mom didn't graduate came to vote on the day. The same study found 'general self efficacy' predicted how likely young people were to vote, especially when they came from those disadvantaged backgrounds. 'General self efficacy' is a measurement of how much people agree with general statements like:

I can do just about anything I really set my mind to.”

I can solve the problems I have.”

Only about 2 of every 10 young people from those disadvantaged backgrounds voted if they were in the lowest 25% on the self efficacy scale, but that proportion rose to 3 or 4 in 10 for the highest 25% on the self-efficacy scale. From 2 to 3 or 4 out of 10 might sound like a fairly small increase but it represents an increase in turnout by an extra half or even doubling of the low-efficacy group.

This leads to an open question – is efficacy something we can induce in prospective voters in this case? Not only does it increase turnout, but stronger efficacy in general seems to be particularly helpful for young people from disadvantaged backgrounds. So finding ways to increase efficacy – even if it is domain-specific to voting – could be particularly effective in addressing social disparities in voter turnout.

It's really striking how much intergenerational influence could potentially affect an entire generation’s ability to have their civic voice heard in elections.

Voter turnout is a problem of motivation and a desire to change an election outcome, in itself, might not be the most powerful motivator to vote for an individual. Many voters probably understand that individually, their vote is highly unlikely to change the outcome of an election, yet because of social norms about voter civic duty, social pressure, peer influence, and gratitude and other psychological factors which can be influenced by even by a voter’s mother’s education, can play a part in getting voters out to vote. Getting voters to vote as a way to make a statement or feel good about participating in a civic duty may be a much more effective way of motivating voters than simply informing them of the issues at stake.

References

[1] http://www.electionresults.govt.nz/electionresults_2011/e9/html/e9_part9_1.html
[2] http://www.electionresults.govt.nz/electionresults_2008/e9/html/e9_part9_1.html
[3] Bischoff, I. & Egbert, H. (2013). Social information and bandwagon behavior in voting: an economic experiment. Journal of Economic Psychology, 34:270-284.

[4] Bryan, C. J., Walton, G. M., Rogers, T., & Dweck, C. S. (2011) Motivating voter turnout by invoking the self. Proceedings of the National Academy of Sciences of the United States of America. doi:10.1073/pnas.1103343108.

[5] Gerber, A. S., & Rogers, T. (2009). Descriptive social norms and motivation to vote: Everybody’s voting and so should you. The Journal of Politics, 71(1), 178–191.

[6] Panagopoulos, C., Larimer, C. W., & Condon, M. (2013). Social pressure, descriptive norms, and voter mobilization. Political Behavior: doi:10.1007/S11109-013-9234-4.


[7] Panagopoulos, C. (2011) Thank you for voting: gratitude expression and voter mobilization. The Journal of Politics, 73(3):707-717.

[8] Condon, M. & Holleque, M. (2013) Entering politics: general self-efficacy and voting behavior among young people. Political Psychology, 34(2): ddoi: 10.1111/pop.12019.